It’s a tough time for p-values. They are getting attacked from all sides. They are so problematic that the very academic journals in which they first became entrenched are calling for their abandonment. Even the American Statistical Association has given us a stern warning to back off. And alongside these is a growing pile of posts and opinion pieces about the mathematical, societal, and moral dangers of p-value abuse.
For all have sinned, and come short of statistical correctness
We all use statistics wrong. There are so many assumptions, conditions, and nuances, it’s almost impossible not to step a foot across the line. The trick is to avoid being Very Wrong. As Stuart from The Big Bang Theory explains, “It's a little wrong to say a tomato is a vegetable; it's very wrong to say it's a suspension bridge.” Being a little wrong means our probability estimate might be off in the second decimal place. Being very wrong means we use our analysis to choose Vendor B when Vendor A is the better option.
The true danger of p-values is not that we will upset an academic by doing it wrong. It’s that the conclusions we draw will be Very Wrong—that we will make an expensive change when the smartest move is to do nothing or that we will believe something is getting better when it’s getting worse.
Case Study: Rejecting a change you should keep
To illustrate how p-values can cause serious problems for you, consider the case of the fictional startup On Belay. This company matches up climbers with each other. Users post their profiles and get presented with a series of potential climbing partners. They swipe right to indicate they’d like to start a chat with a potential partner.
Since the inception of the company, On Belay has used an algorithm (Algo A) to choose which potential partners to present. Now their ML team has recently developed a more sophisticated approach (Algo B) based on the latest and hottest recommender techniques, and a decision needs to be made about whether to transition over.
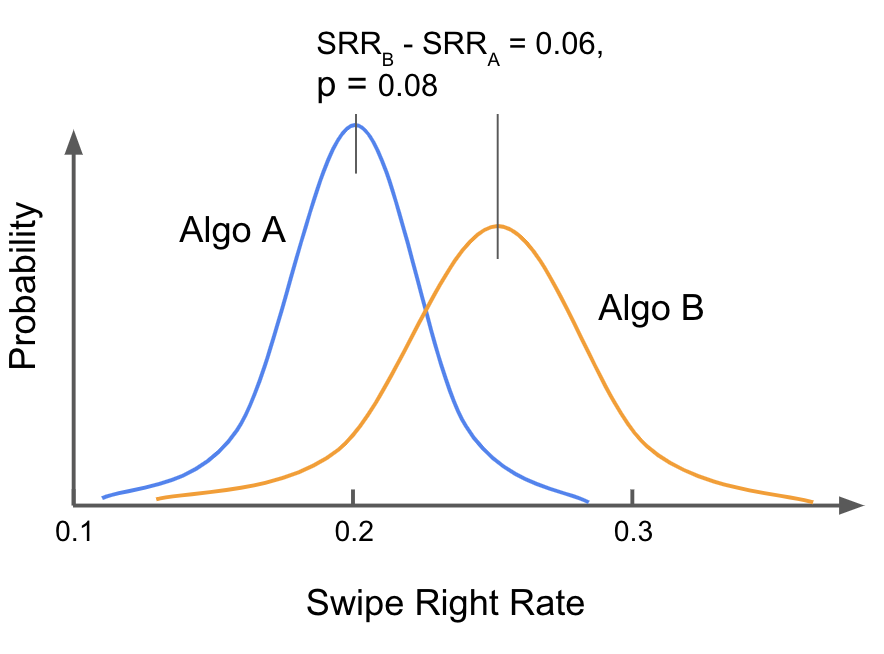
An A/B experiment was designed and carried out. In a rare show of discipline, nobody kept a running estimate of the results or repeatedly calculated the p-value during the experiment. It was all done by the book. At the conclusion of the experiment, the mean swipe-right rates (SRR) for Algo A and Algo B were calculated, and the p-value for the unpaired t-test was calculated.
The final p-value came in at 0.08, higher than the 0.05 threshold that we all use as the convention for statistical significance. Algo B was not shown to be significantly better than Algo A. Because of this failure to show the advantage of Algo B, it was rejected.
But hold on a minute. Let’s take a closer look at the analysis. What we actually learned is that, if we knew the Algos had identical SRRs, a difference of at least the size we observed would still occur 8% of the time, about 1 in 12. This pedantic word mincing is important, because it helps us to understand that very likely Algo B performs better than Algo A. The outcome we saw was unlikely to occur if there was no difference between the Algos. It just happens to fall short of the arbitrary 0.05 threshold chosen for p in ages past. Switching to Algo B is clearly the better bet.
The fundamental problem is not that p-values are bad, but that they answer a different question than the one we care about. We are interested in whether Algo A or B is likely to perform better. p-values don’t actually answer this. p-values focus on whether B performs better than A with high confidence. Many times we are less interested in high confidence than simply making the best bet with the data available. p-values can paralyze us with demands for more data or bog down growth by driving us to stick with the status quo.
Another Way: Confidence Intervals
How can we avoid falling into this trap? There’s no single fix, but one useful tool is confidence intervals.
Here’s another way to look at our results.

The world of statistics is all about distributions. We don’t actually get to measure a swipe rate; we only get to make a fuzzy estimate of it. We collect a bunch of observations, and generate a fat blurry smear of where we believe the actual SRR sits. The function of the t-test is to say whether one smear is confidently higher than another smear, but it can never say for certain because it never knows exactly where the real value lies.
For our purposes, what we really want to know is which SRR is most likely to be higher than the other. The typical way to report these results is to give the densest point in each distribution (the peak of the distribution curve here, also known as the point estimate) as the actual value, paired with the p-value. This doesn’t answer our question well at all.
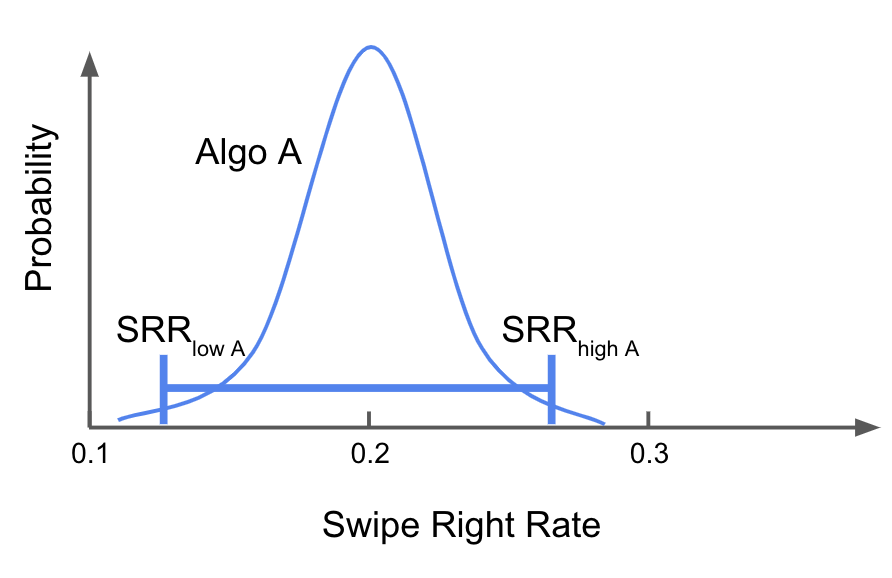
Instead, we can get a better sense of how wide each distribution is by looking at the 95% confidence interval. This is that range that probably contains the actual SRR, although there’s still a 1 in 20 chance it will miss it. (Warning: This phrasing is not quite accurate and if you explain it this way to a statistician they will get mad at you. But in the grand scheme, this is only minor statistical sin.)

Comparing the confidence intervals for Algo A and and Algo B tells a different story than the p-values. While there is a lot of overlap, the lower bound of the CI for Algo B is higher than that of Algo A. The same goes for the upper bounds, and there the difference is even more pronounced. Forced to choose one over the other, B is clearly the better choice. Here confidence intervals are much better than p-values at answering the question we’re interested in.
![The probability distributions for the mean Swipe Right Rate of
Algo A and Algo B together with their 95% confidence intervals.
CIs are labeled
CI_A = [0.12, 0.27]
and
CI_B = [0.14, 0.34]](/images/p_values_rant/img_02.png)
There are other ways p-values can mislead. We haven’t even touched on how they lead us to ignore effect size, or how point estimates get treated as exact once p falls below 0.05, or how the irresistible temptation to peek during testing inflates significance. In all these cases, the recourse is similar. Focus on the question you’re trying to answer instead of automatically falling back to p-values. And if you’re not sure what else to do, use confidence intervals to represent your distributions. They will never betray you.
Why are p-values so sticky?
We humans hate uncertainty. Our minds reject it. When we try to reason about it, our thoughts slide across the surface of it like a drop of water on a hot griddle. It resists us. Makes us uncomfortable.
Yet at the same time we have to make decisions in an uncertain world. Buy or sell? Hire or reject? Feature A or Feature B? To make decisions with confidence we want hard facts and clear direction. Uncertainty stubbornly refuses to offer these. Instead it gives us possibilities, distributions, and varying degrees of maybe. Of course we hate it. Uncertainty means that no matter which decision we make, we are partly wrong.
In this light, p-value abuse performs a valuable function. It takes the uncertain and makes it known. What was unclear becomes sharp. What was blurry snaps into focus. If a point estimate is significant, it can be relied upon. If it is not significant, it can be ignored.
Of course we know this is wrong. I suspect most of the people who rely on p-values as a cognitive crutch would also tell you they know it’s wrong. But that doesn’t stop us from doing it. We are not disciplined enough to be trusted around p-values. When analysis is being used to inform decisions our safest path is to set p-values on a high shelf, shove them to the back of the closet, and focus on less misleading analysis tools like confidence intervals. We can accept our burden of uncertainty. No matter how badly we want it, we can't expect our data to make our judgement calls for us.